Reports
Path: /reports
Image: 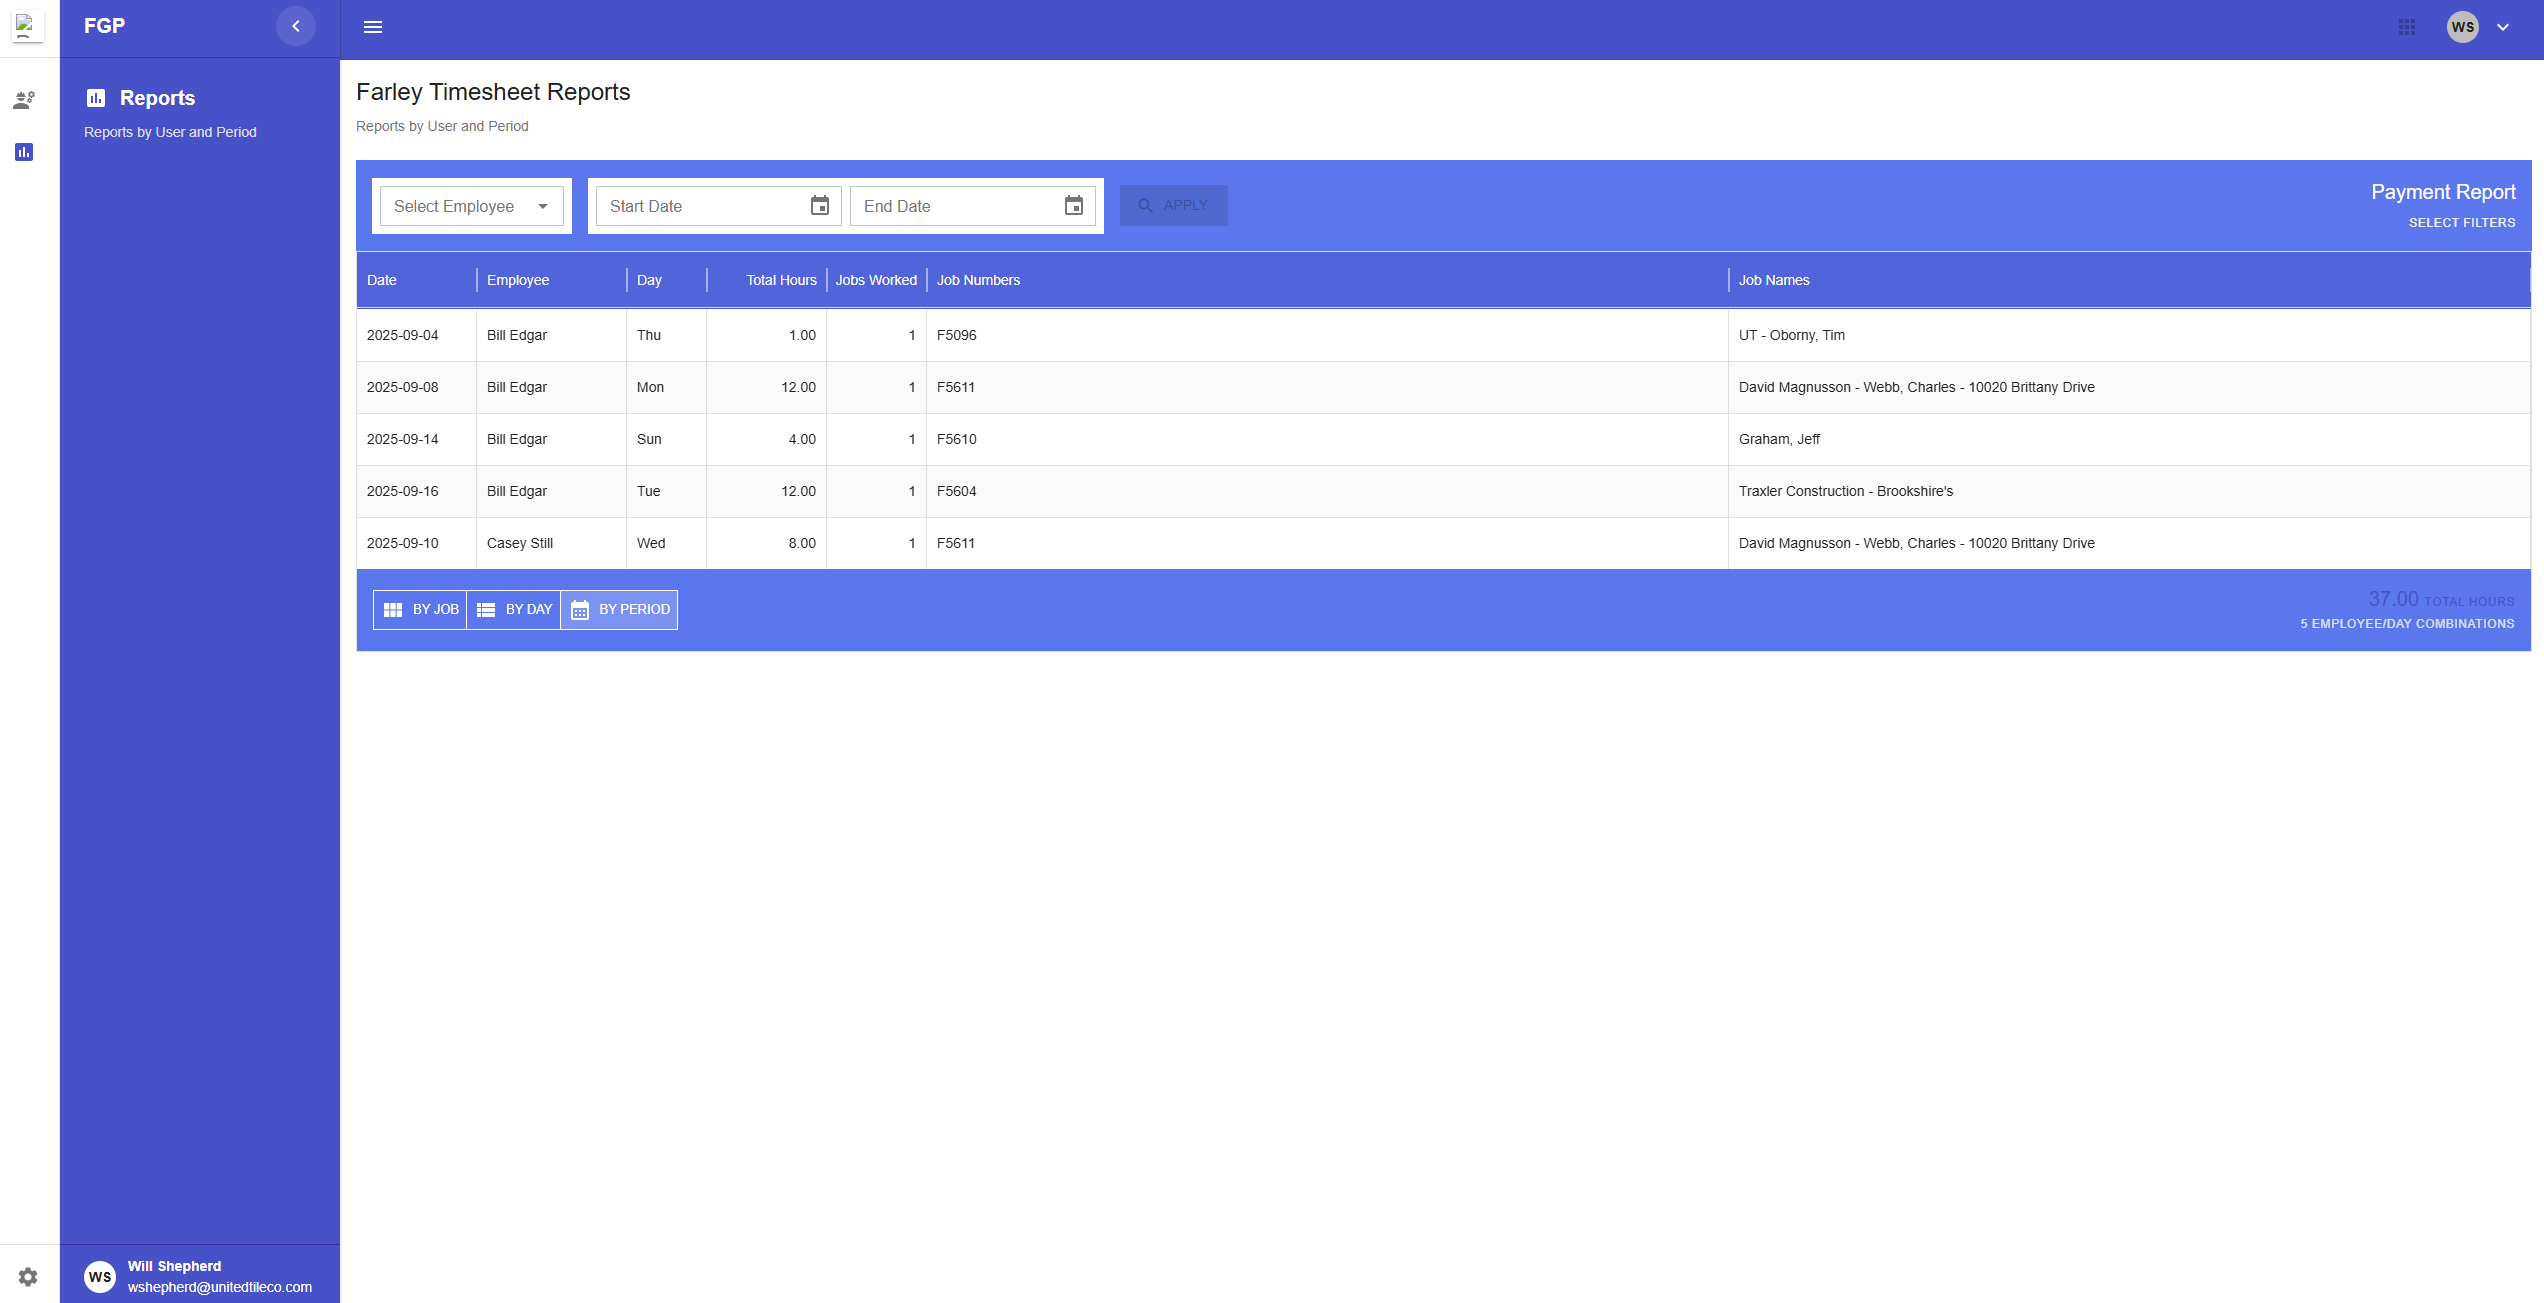
Page Sections
Header and Filters
At the top of the page is a filter bar to control the data shown in the report.
- Select Employee: A dropdown menu to filter the report for a single employee.
- Start Date / End Date: Two calendar fields to select a date range for the report.
- Apply Button: Updates the report table with the selected filters.
- Clear Button: Removes all filters and shows the complete report.
Report Table
This table displays timesheet data based on the selected filters. The information can be viewed in three different ways using the toggle buttons in the footer.
Footer
The footer is at the bottom of the table and contains view controls and a summary.
- View Toggles: Buttons to switch between "By job," "By day," and "By period" views.
- Total Hours: A display showing the sum of all hours in the current report view.
Page Actions
Filtering the Report
- Use the Select Employee dropdown or the Start/End Date calendars to choose your filters.
- Click the Apply button to update the table.
- To remove all filters, click the Clear button.
Changing the Report View
You can change how the data is grouped and displayed by clicking the toggle buttons in the footer.
- By job View: Groups entries by employee and job, showing the total hours worked by an employee on a specific job within the selected date range.
- By day View: Shows every single timesheet entry as its own separate row in the table.
- By period View: Groups entries by employee and date, showing the total hours an employee worked each day across all jobs.